
The Mutual Fund Factsheet houses crucial details about the scheme, encompassing its objectives, portfolio, risks, returns, & more.
In this blog, we delve into the key indicators in the MF Factsheet that shed insights on equity and related MF schemes.
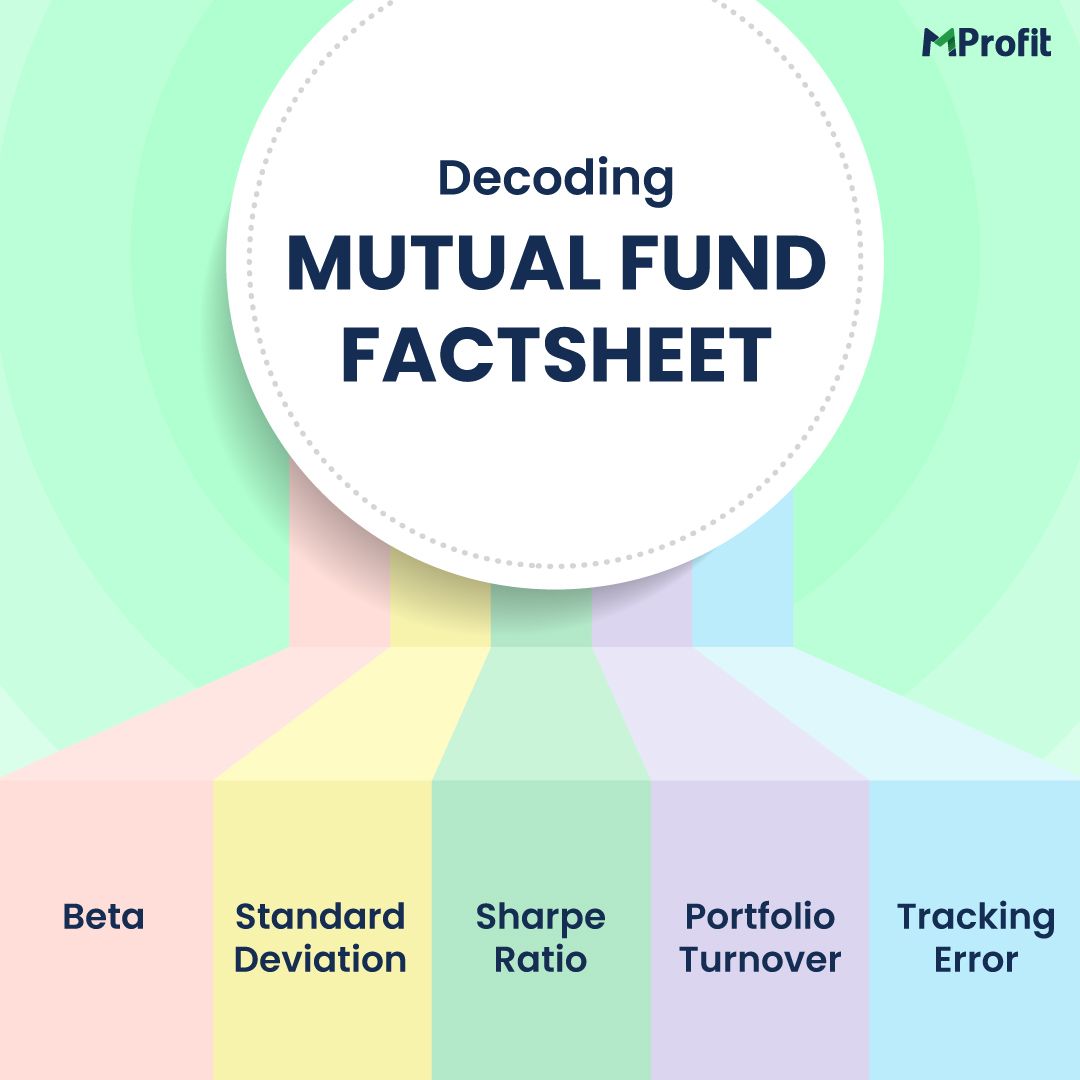
The Mutual Fund Factsheet includes quantitative parameters that provide statistical insights into a mutual fund’s performance, composition, and structure.
Here are a few important metrics to look out for while making investment decisions:
Beta – Lower the better
Beta is the volatility of the Mutual Fund with respect to its benchmark indices like Nifty or Sensex.
Beta > 1 indicates that the MF is more volatile than the benchmark.
Beta < 1 indicates that the MF is less volatile than the benchmark.
Standard Deviation (SD) – Lower the better
SD indicates how much the fund’s returns deviate from its average return over a specific period.
A higher SD suggests that the fund’s returns have fluctuated widely from the average, indicating higher volatility or risk.
Sharpe Ratio – Higher the better
In simple words, the Sharpe Ratio is the return delivered by the mutual fund per unit of risk taken.
A higher Sharpe Ratio suggests a better risk-adjusted return because the fund is generating more return per unit of risk taken.
Portfolio Turnover – Lower the better
In simple terms, it means the number of times the mutual fund has bought/sold equity and related instruments.
Lower Portfolio Turnover means the fund is not buying/selling too many stocks in a year.
Tracking Error (TE) – Lower the better
TE refers to the divergence between the fund’s performance and its benchmark index.
A lower TE suggests that the fund closely mirrors the benchmark’s returns.
It is one of the most important metrics when choosing index funds.
The MF Factsheet also tells you some important facts about the scheme like:
Fund Manager’s Name
In actively managed schemes, a fund manager plays a crucial role as he manages the money pooled in by investors.
Any change in the fund manager is updated in the factsheet.
Assets Under Management (AUM)
It is the total money managed by the scheme on behalf of the investors.
AUM is a significant metric used to assess the size and scale of an Asset Management Company (AMC) and its ability to manage assets for its clients.
Expense Ratio
This is a percentage that denotes the fee paid to the AMC to manage your investments.
i.e. the per-unit expense of operating and managing the mutual fund.
Expense Ratios vary from 1 – 2 % depending on the mutual fund scheme.
Portfolio Holdings
Portfolio holdings refer to the stocks, bonds, cash equivalents, or other financial instruments that the fund owns.
Understanding portfolio holdings helps investors comprehend the fund’s diversification, risk exposure, and investment strategy.
Entry and Exit load
It is the fee charged by the fund house at the time of buying or selling the MF units.
These loads are subtracted from the invested amount or the redemption proceeds, reducing the returns for investors.
Returns
The factsheet contains the scheme returns since inception and returns wrt to the benchmark for a specific period.
It is crucial to note that a fund’s past performance does not guarantee future returns.
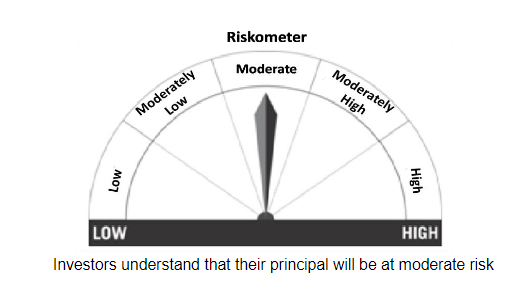
Riskometer
The riskometer scale represents the risk associated with the scheme as per SEBI product labelling guidelines.
Each scheme is assigned a specific position on the scale based on its risk profile, & factors such as volatility, market risk, liquidity, etc.
Conclusion
The Mutual Fund Factsheet is an excellent tool which the AMC publishes for every scheme each month.
One must always read the factsheet before investing and make informed decisions based on your financial goals and risk-return profile.


Comments